
Database modelling and ERDs

Data is perhaps the most important part of any software system; And it lives in a database. A database can be defined as a system in which data is stored in an organized format to allow analysis, easy-access, manipulation and, if necessary, augmentation. In order to come up with a database system that meets all the needs of a system, software developers take on a process commonly referred to as database modelling. This process involves defining and analysing a system’s data requirements, determining what information is needed and how it will be organized or accessed and ultimately coming up with a visual architecture of the intended database for development.
There are two main data modelling techniques used in the data modelling process. They are:
- Entity Relationship Modelling (ERM) which results into Entity Relationship Diagrams(ERDs).
- Unified Modelling Language (UML) which results into UML diagrams most common one being Class Diagrams.
While there are no earth-shattering differences between the two, it’s worth noting that;
ER diagrams represent the abstract representation of the data model, while class diagrams represent the static structure and behaviour of the proposed system. Class diagrams are more likely to map real-world objects, while ER diagrams most often map into database tables. There are plenty of occasions where an entity of an ER diagram maps to single or multiple classes of the corresponding class diagram and vice versa. But, this depends entirely on the design choices of the developers. source
This particular post, however, as the heading suggests, will focus more on ERDs.
Entity Relationship diagram
An ERD (Entity Relationship diagram) is a graphical representation of interrelated things of interest in a specific domain.
In software engineering, it refers to the things (entities) software needs to remember to fully perform business processes.
ER diagrams are related to data structure diagrams (DSDs), which focus on the relationships of elements within entities instead of relationships between entities themselves.
There are four basic components of an ER diagram:
- Entities: definable objects or concepts about which data stored.
- Attributes: Properties or characteristics of entities.
- Relationship: The relationship between the entities.
- Cardinality: possible number of occurrence in one entity which is associated with the number of occurrences in another.
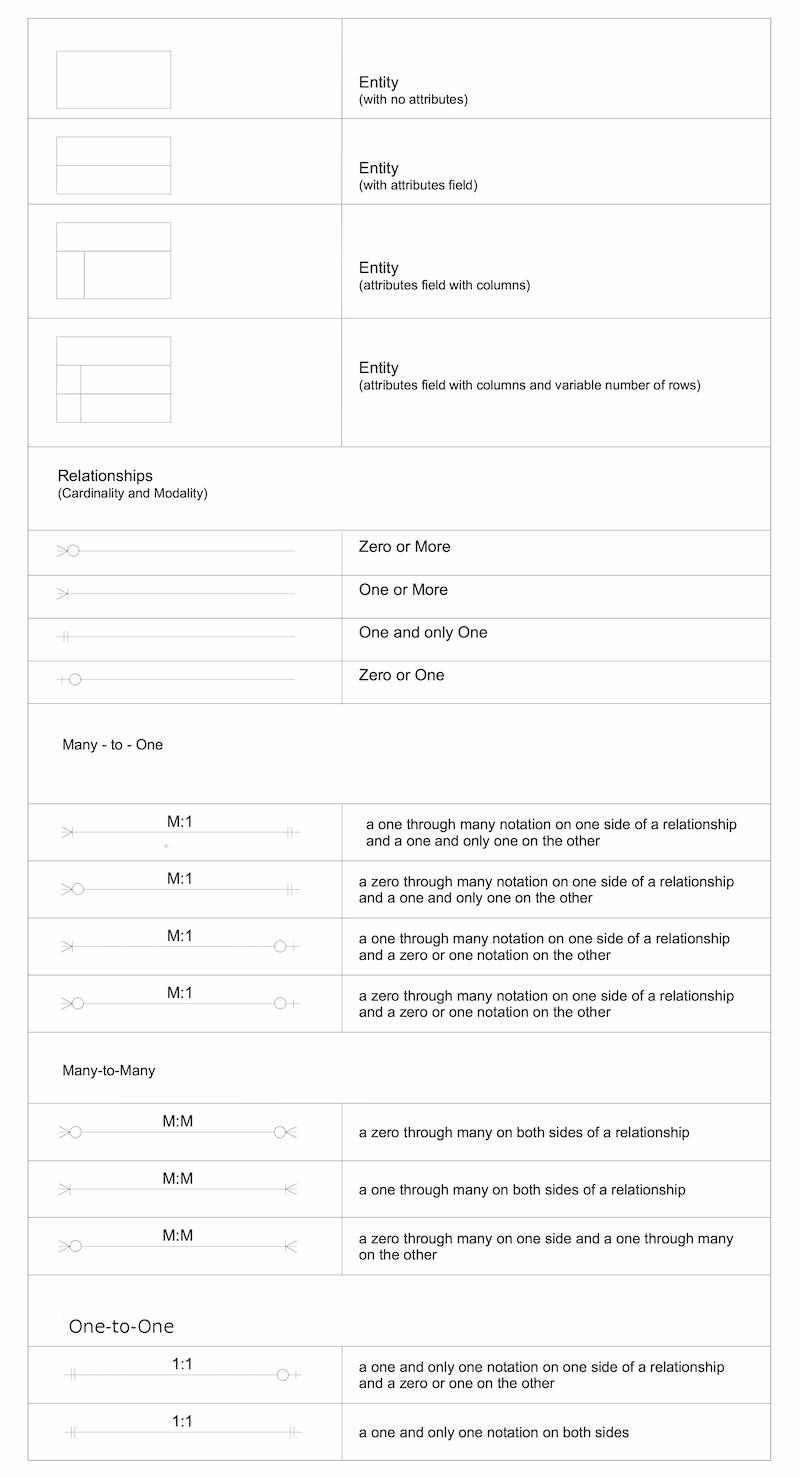
There are a number of symbols and notations used to represent these components when coming up with an ER diagram.
The most popular and recommended of these symbols and notation styles is the Crow’s Foot/Martin information Engineering style
Crow’s Foot/Martin information Engineering style.
Types of data models.
ERD diagrams are used to come up with visual representation of the data modelling process. Up to three levels of abstraction can be achieved in the process;
- Conceptual data model. A high-level description of the project’s or software’s information needs. It specifically describes the entities about which information will be collected and their relationship to one another. This level hardly contains any details available for the physical database structure. It translates into a logical data model.
For example;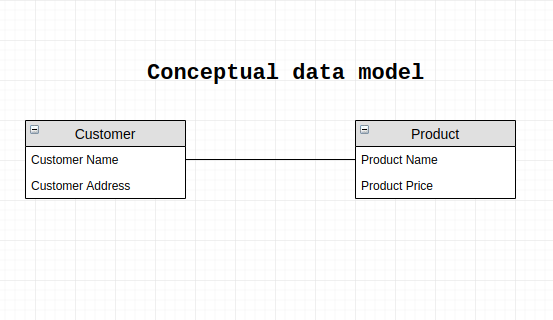
-
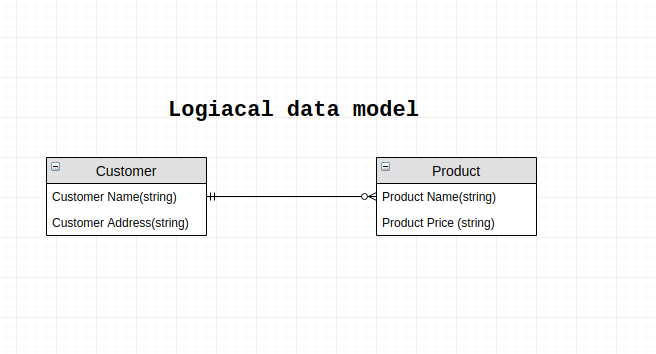
Logical data model. The logical data model is based on a conceptual data model. Since logical data models anticipate implementation on a specific computing system, it describes the internal details of physical storage(relational or non-relational). It defines how the system should be implemented regardless of the DBMS (Database management system). Logical data models are technology independent. For example;
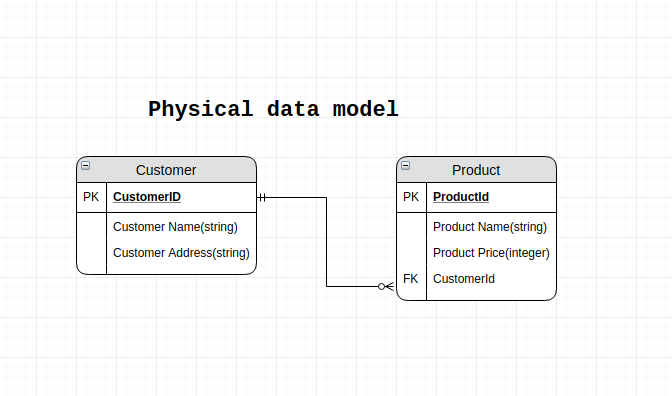
- Physical data model. It describes the specific implementation of the data model. A complete physical data model will include all the database artefacts required to create relationships between tables or to achieve performance goals, such as indexes, constraint definitions, linking tables, partitioned tables or clusters.
For example;
Associations are also indicated in the process. Here is an example of a physical model showing a many-to-many association which is structured through a join table.
.png)
Tools
Here are some tools that can be used for database modelling:
- dbdiagram.io
- Draw.io
- Lucidchart
- QuickDBD
- SQLDBM
- MySQL Workbench (very popular)
- StarUml
- SQLEditor (Mac only)